More detailed
Photoemission
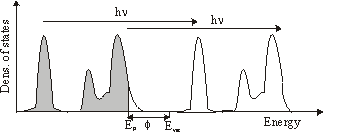
In plain words photoemission is the ejection of an electron from a solid by absorbing a photon. The energy of the electron is given by \mathrm{E_{kin}} = h\nu-\mathrm{E_b} -\Phi
where h\nu is the energy of the photon, \Phi the workfunction of the solid and EB the binding energy of the electron in the solid.
This can be carried out in photoemission spectroscopy. Here the medium is illuminated by monochromatic light (eg. HeI lamp: 21.1eV). By measuring the energy distribution of the ejected electrons N (Ekin) you can get the density of states N (Eb).
If available, it is even better to use a variable monochromatic light source from a synchrotron and meassure N( h\nu ) at a fixed kinetic energy of the analyzer.
The minimum of the mean free path of electrons in solids is about 10 to 100eV. Operating with a light source in this regime gives a high surface sensitivity.
Two-photon photoemission
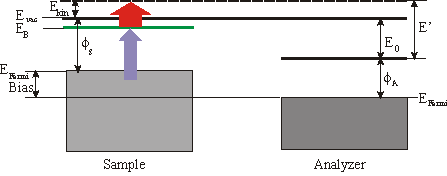
With photoemission spectroscopy just occupied states can be probed. But with two-photon photoemission you can examine occupied and especially unoccupied surface states. If you take a photon energy just below the workfunction you can populate the unoccupied states without having direct photoemission. The probing photon can now eject the electron from the surface.
Quite frequently a small bias is applied between the sample and the analyzer to enhance the countrate. In the following consideration we will focus on a 3\times h\nu (=UV) pump pulse and a 1\times h\nu (=IR) probe pulse. The binding energy EB with respect to EFermi of an unoccupied surface state is then given by
\mathrm{E_{B(Fermin)}} = \mathrm{E´} - 1\times h\nu-\mathrm{Bias}
whereas \Phi_\mathrm{A} is the workfunction of the analyzer and E’ the measured energy. The spectrum also consists of a low background which is due to two-photon photoemission without any unoccupied state in resonance and from photoemission from thermally excited electrons. Sometimes it is convenient to specify the binding energy Ebwith respect to Evac. Then EB can be calculated by
\mathrm{E_{B(Fermin)}} = \mathrm{E´} - \mathrm{E_0} -1\times h\nu.
E’ is the measured kinentic energy of the electron. The workfunction of the sample is given by
\Phi_s = \Phi_A +\mathrm{E_0} -\mathrm{BIAS} .
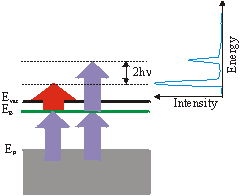
Up to now we have always assumed that the 1\times h\nu (IR-)pulse excites the electron above the vacuum level.
But the 3\times h\nu (UV-)pulse can also eject the excited electron. The corresponding 3-3 signal is then 2\times h\nu above the 3-1 signal. This can be used to derive the frequency of the photons from the spectrum: h\nu = \left(\mathrm{E_{3-3}} - \mathrm{E_{3-1}}\right) /2.
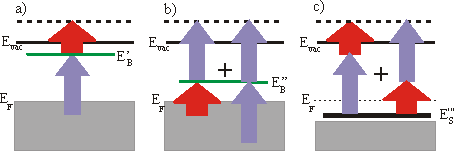
So far we always regarded 3-1 processes, which means that the UV pulse is populating the level and the IR pulse is probing it. But you can get a peak at the same energetic position in the spectrum by the reversed 1-3 process, if the unoccupied state lies energetically 2\times h\nu lower than a state determined by assuming a 3-1 process. This ambiguity can be solved by varying the wavelength. The IR-probed peak changes linearly with 1\times h\nu whereas the UV-probed peak shifts linearly with 3\times h\nu . You could also distinguish these two processes by varying the delay between the two pulses, if the probed state has a measurable lifetime. A peak in a spectrum could also arise from a resonant surface state below EF. The electron is excited in a virtual intermediate state before being ejected by the second pulse. This process can again be distinguished from the other processes by changing the wavelength. In this case the peak shifts with 4\times h\nu . As there is no resonant intermediate state, a transition is less likely and is only possible, if there is a good overlap of the two pulses in space and time. Usually the probing/IR pulse has a higher power than the UV pulse to reduce a high background from direct photoemission from thermally excited electrons.
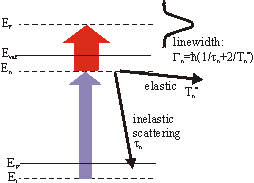
So far we have just regarded energy-resolved measurements. But with 2PPE it is also possible to do time-resolved experiments. By varying the delay between the pump and probe pulses the mean lifetime can be extracted. This requires pulses which are short compared to the lifetime. The change of the number of electrons in the unoccupied state is proportional to the negative number of electrons NE(t) itself
\frac{dN_E(t)}{dt}\propto-N_e(t).
Therefore we get a exponentially decaying population:
N_e(t) = N_E(t_0)\,e^{-t/\tau}.
A typical time-resoved spectrum can be seen in the section Examples. Beside the experimental resolution this finite lifetime contributes to the linewidth Gn in the energy spectrum. But the linewidth also contains an additional term
\Gamma^*_n = \frac{2\hbar}{T^*_n}
from quasielastic scattering which leaves the electrons in the excited state but destroy the phase coherence(e.g. scattering with phonons or defects). Thus the total linewidth is given by
\Gamma_n = \frac{\hbar}{\tau_n}+ \Gamma^*_n .
